Have you been wondering if the reports provided by Google Analytics are providing you with good and accurate data? Do you wonder if the insights you take away from the reports are failing because of execution or the precision of the data? Or are you planning to incorporate multi-channel attributions and merge your online and offline actions? In this blog, we’ll show you how to test and evaluate the quality of your current Google Analytics account.
For this evaluation, we will use Google Data Studio and a template I’ve created to guide us through. Don’t worry if you’ve never used Data Studio before, this template and guide will provide you with everything you need. If you can mouse over and click, you’re in good shape to use this evaluation. Just make sure you login to Data Studio with the same email login you use for Google Analytics.
One last note: if you want to skip this audit altogether and have one of our professional Google Analytics certified analysts provide you with a more complete evaluation, you can send the request by clicking here. We will need your email address and website URL, and you’ll need to provide us access to the property level of your Google Analytics.
Step-by-Step Instructions
1. Click on this link that will take you to a Data Studio dashboard
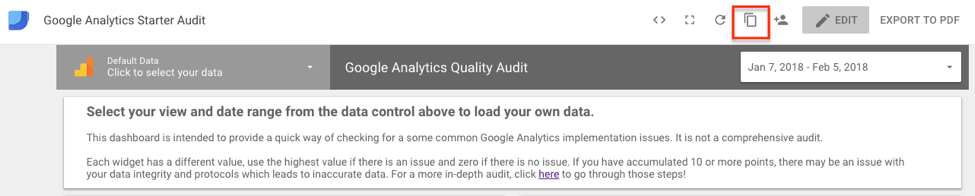
2. Click on the copy button on the top right-hand side of the page
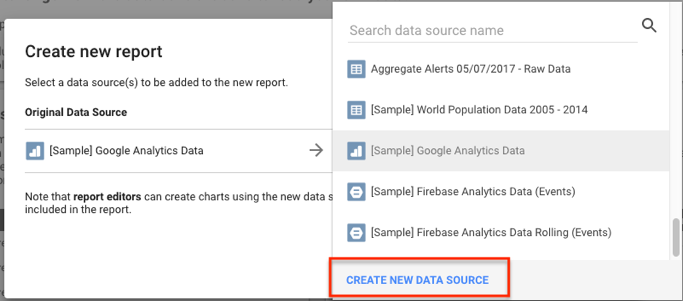
3. You will be prompted to select a New Data Source. Make sure you are logged into your Google Analytics account. Click on the drop-down arrow and click on “Create New Data Source”.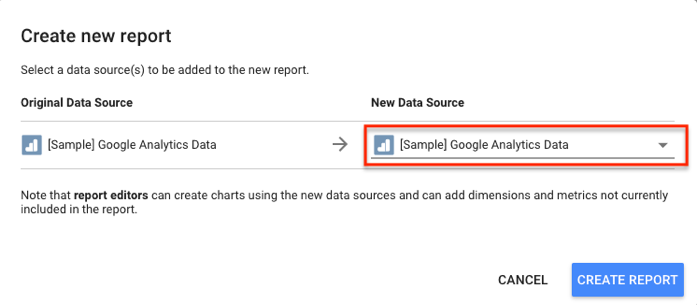
4. Next, you will click on “Google Analytics”, and authorize Data Studio to connect to your Google Analytics account(s).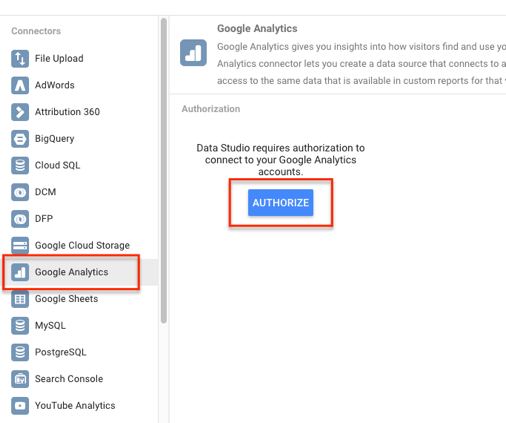 5. From there you can click on the preferred Google Analytics Account, Property, and View you wish to analyze. If you have multiple accounts under the same login, you only need to do this once.
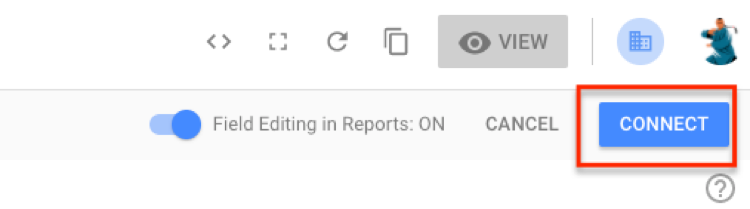
6. Once you’ve made your selections, you will click on “Connect” at the top right-hand side.
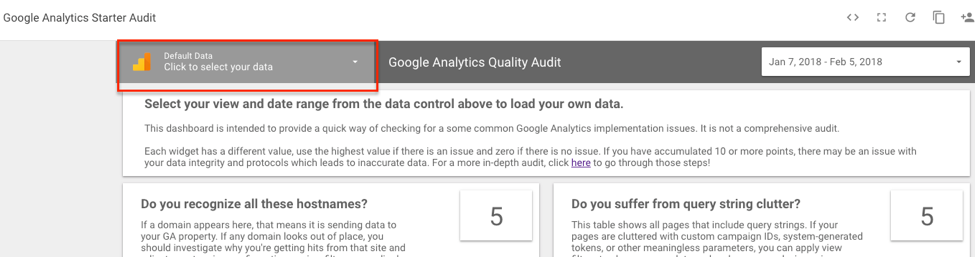
 7. Now all of your data will be showing up on the dashboard. If you wish to select a different property or view, simply click on the filter drop-down on the top left-hand corner of the dashboard.
Auditing your Data
Now that you’ve set up your dashboard, you can start the audit! For the first four boxes, mark it a 5 if you are seeing significant page views for each portion, and between 1 and 4 depending on the amount of traffic and number of dimensions (hostnames, pages, sources, campaigns).
Accurate hostname(s)?
The first step is to look at the hostnames that are sending data to your property. Take a look to see if anything looks out of place. If there’s a domain that looks off, you need to investigate why your account is getting hits from the site. You might need to adjust or add filters to make sure your data is clean and only coming from your domain.
Query String Clutter
Next, you will look at query string clutter, where you can see if your pages are showing meaningless parameters. This will affect the way you look at aggregated data. For example, if you want to see how your products and services page is performing, having these parameters that are appended to the URL will see the single page as multiple pages.
Example:
https://www.example.com/products-services?vid=12345 and https://www.example.com/products-services?vid=12346 won’t be the same as looking at just the /products-services page. This will mark it as 2 separate pages.
Of course, you can build out content grouping to look at your aggregated data, but with a quick fix, you can eliminate these parameters from your URLs.
Referral Traffic
The third box shows all the sources coming in from referrals. This is a quick and dirty way to look to see if you have an issue with cross-domain tracking, referral exclusions, missing tracking, and any spam that may be hitting your site. If any of these sources look out of place to you, then it’s time to do a deep dive into what the issues might be. Adjusting your settings and/or adding filters will help fix this problem.
(Other) Traffic
Box number four shows everything that’s being categorized as “Other” on your default channel groupings. If you are seeing sources/mediums that belong in a different channel, then you have an attribution problem. To fix this issue, you might want to look at your parameters when creating Urchin Tracking Modules (UTMs) or adjust the channel groupings to match your naming conventions.
PII
In the second-to-last box, you will want to see if you’re collecting any personally Identifiable Information (PII). If you are, you run the risk of Google deleting your GA account. There are various steps that need to be taken which are customized on your situation. Getting in front of this issue sooner rather than later is the best way to plan for a worst-case scenario. If you are seeing any PII passed through the URL, you should mark it at 15 points, which means you need to take immediate action to correct this issue.
Event Categorization
The last box is really a preference and a gut check to make sure your events are being organized in a way to efficiently analyze your data. If you see anything that needs to be adjusted, this is the time to revisit your naming conventions.
Final Score
Now is the time to tally up your points from the six boxes. If you’ve accumulated more than 10 points, then there may be an issue with your data integrity and protocols, and you need to take immediate action to correct this. If you scored a 5 on boxes one through five, then you need to correct those individual issues that are corrupting your data.
What now?
This evaluation test is by no means a complete evaluation of your Google Analytics account. It is an accurate guideline that should signal if a professional analysis and data strategy are needed. You can conduct a deeper audit into your analytics by following the steps of this blog. If you want a comprehensive audit on your GA account, contact us here so we can conduct a Data Integrity Scorecard and review the results with you!